It is almost as if both uncertainty and inconsistency are leaping off our monthly reports. Looking at the fleets, dealers and distributors that were surveyed last month as part of our DataPulse Plus, their results span the spectrum. There are those that indicate confidence is returning and the November elections will result in a positive future. Others have not experienced any uptick and continue to experience declines. And then there is the middle of the road — those who have seen no change at all in their parts sales and do not expect parts sales to get much better.
Looking at the greater economic picture would tell us that the recovery is well underway. And as we examine the next nine months, the economy is not expected to decline.

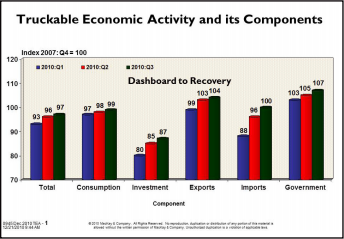
One of the tools developed and utilized by MacKay & Company as an indicator of trucking demand based on the GDP statistics is TEA®, Truckable Economic Activity. TEA® includes only those components of real GDP that can move by truck:
• Consumer Goods
• Investment Goods
• Export and Import Goods
• Government Purchases of Goods
TEA® also differs from GDP in that it counts imports as a positive. Goods have to move from their port of entry to their final destination. The value of imports is counted at 50 percent because imported goods do not generate as many truck moves as domestically produced goods. In addition, TEA® counts the change in inventory as a positive; goods have to move to and from the warehouse.